
What do groceries really cost right now?
StapleWatch tracks the price of eggs, milk, beef, coffee, gas, electricity and 30+ other everyday staples, so you can see what moved, by how much, and where it has been heading.
Free with ads. One-time Pro upgrade, no subscription.
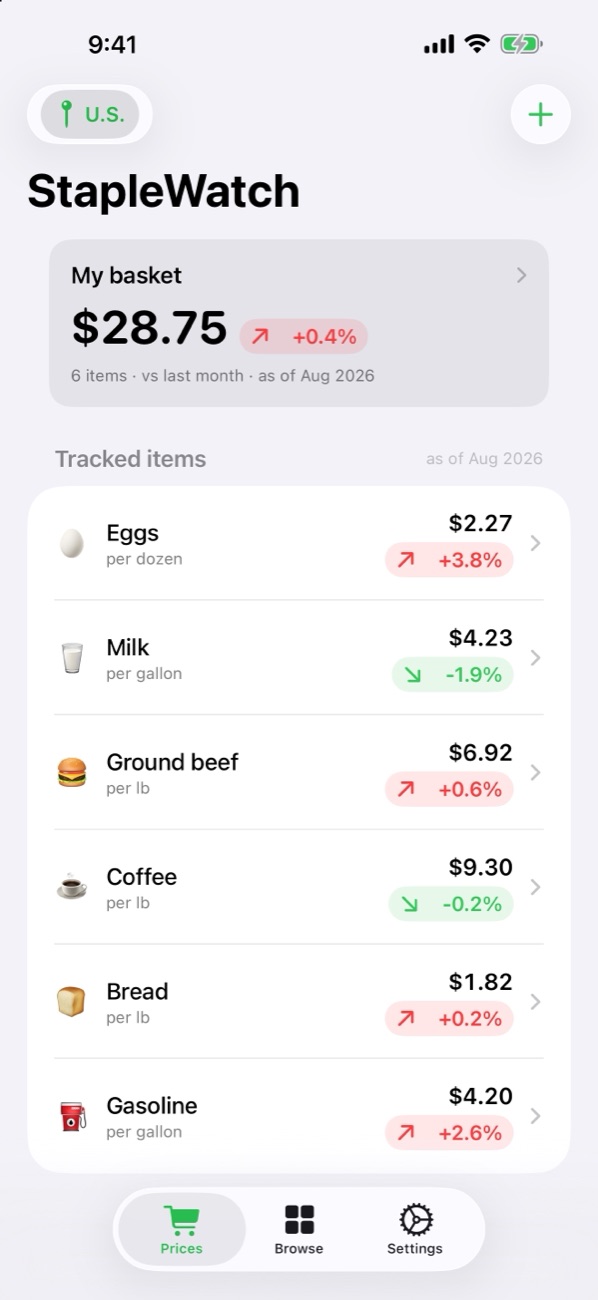
One glance. Real numbers.
No coupons, no shopping lists, no guesswork. Just what things cost and which way they are going.
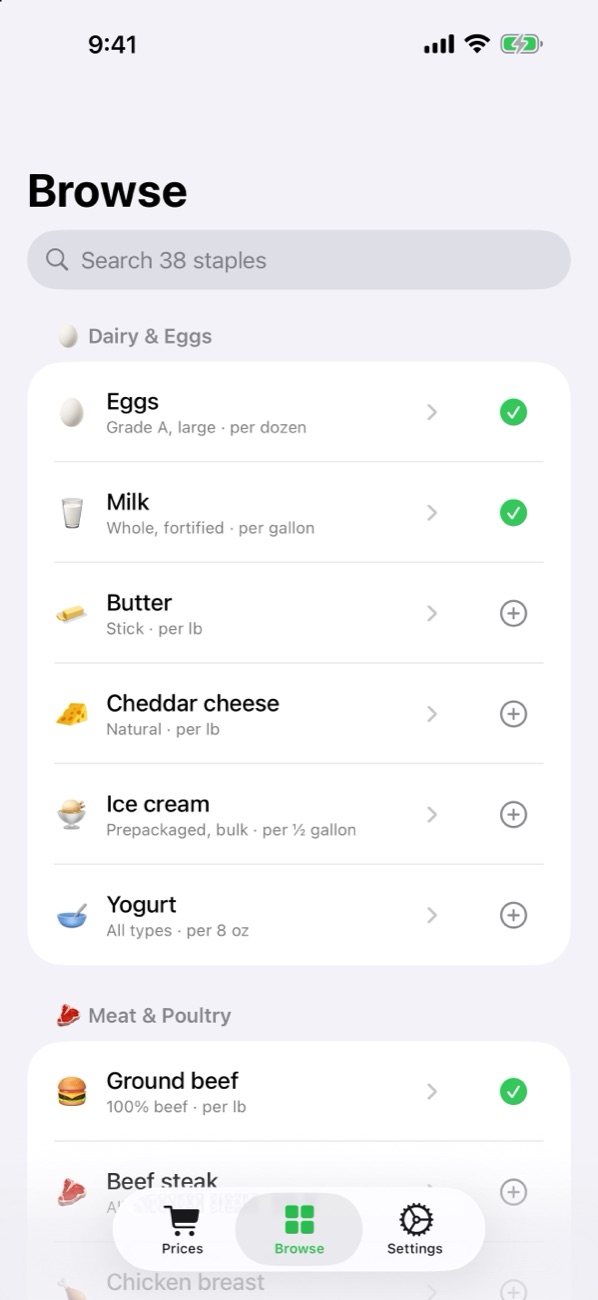
38 everyday staples
Eggs, milk, ground beef, chicken, bacon, bread, coffee, bananas, gasoline, electricity and more, across dairy, meat, produce, pantry, drinks, and energy.
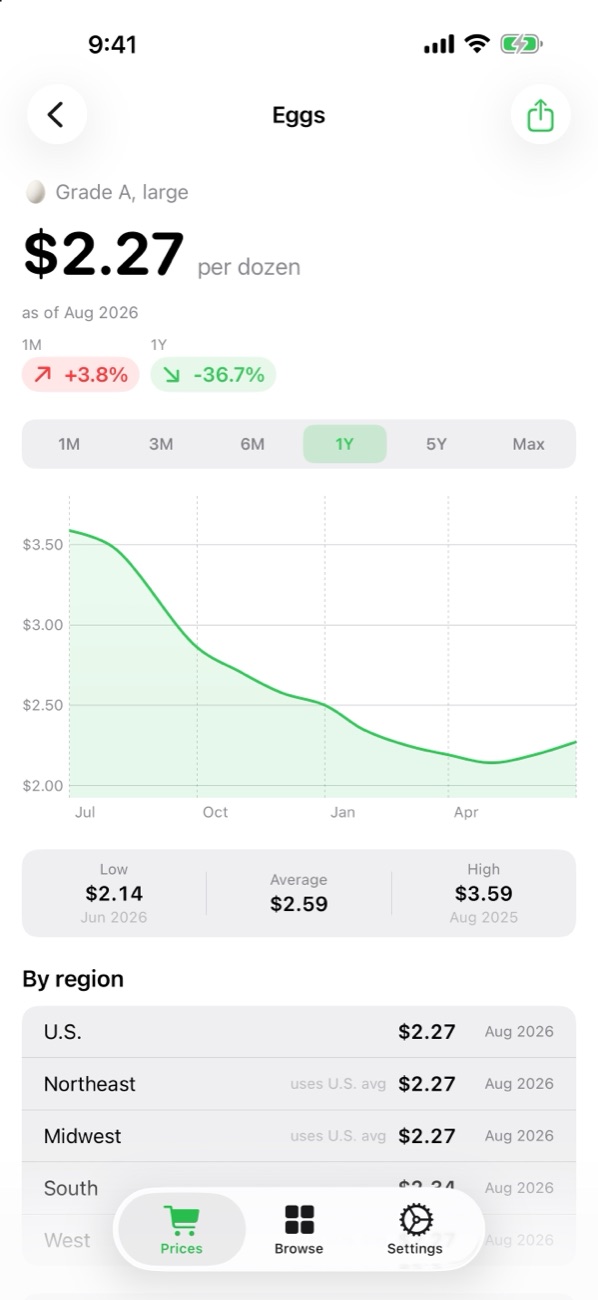
Up or down, at a glance
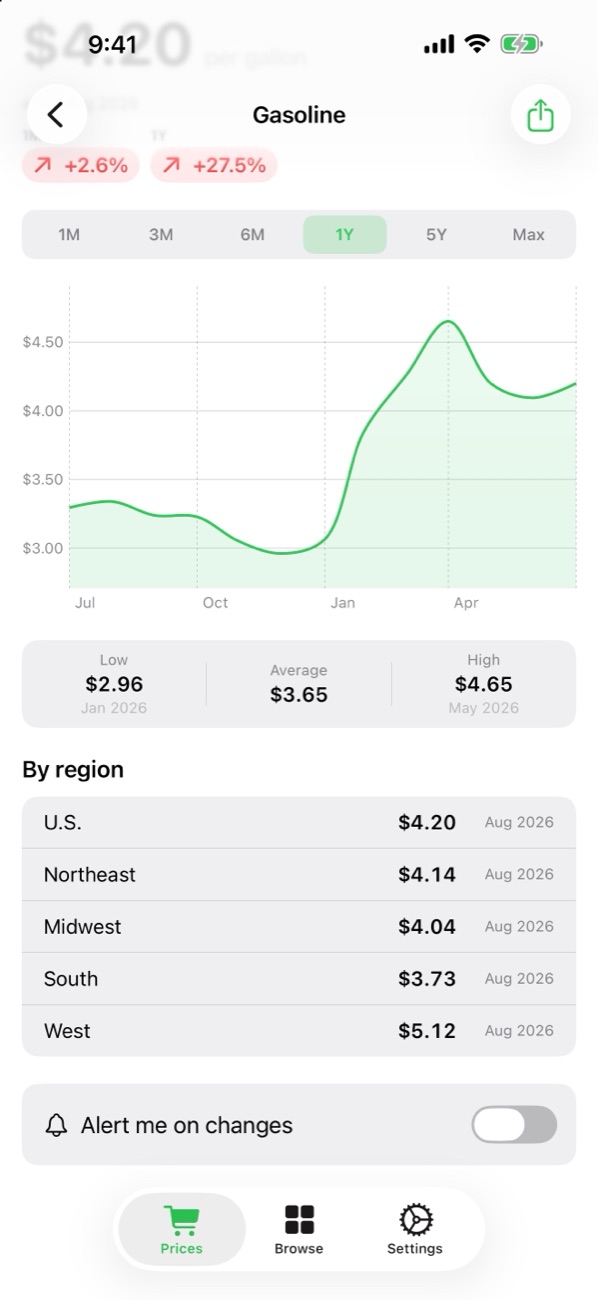
The current U.S. average price with the change versus last month and last year, in percent or dollars.
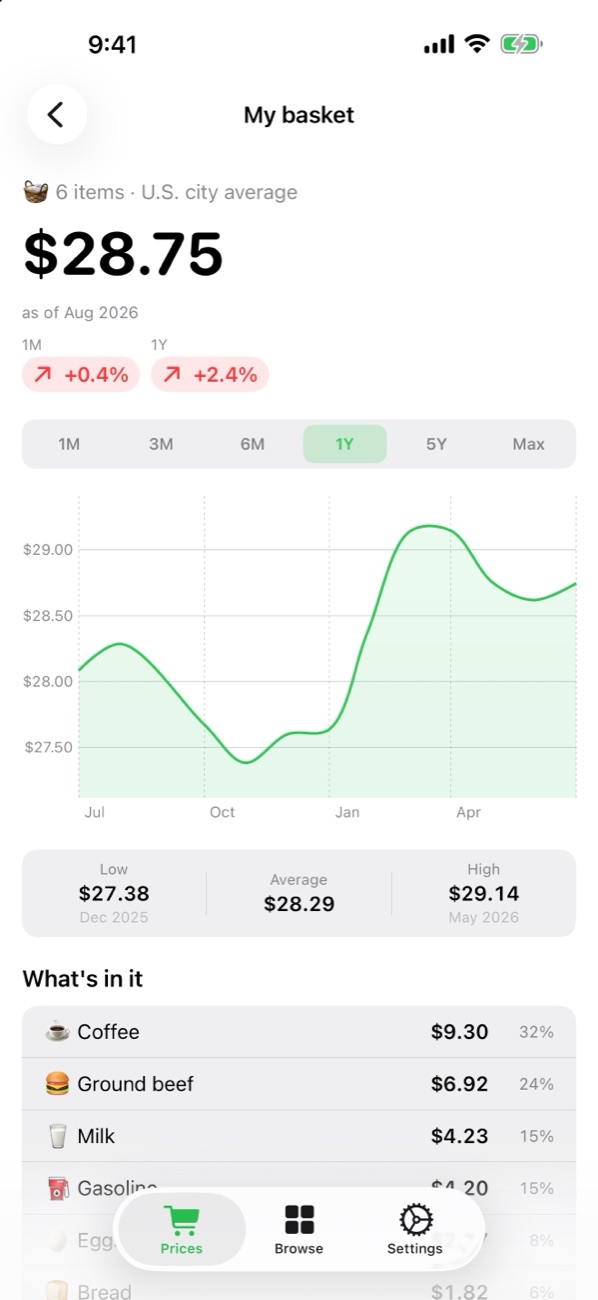
My basket
One number for everything you track, and how much it moved. The grocery bill, distilled.
Widgets
Home Screen and Lock Screen widgets put the number in front of you before you open the app.
New-data heads-up
An optional monthly notification when the new numbers are published.
Works offline, no account
The latest prices are stored on your phone. No sign-up, no login, nothing to manage.
Built for one-handed checking
One purchase. Yours forever.
Pro is a single in-app purchase, not a subscription. Buy it once and it stays unlocked on your Apple Account.
- No adsBanners and interstitials gone, forever.
- Unlimited tracked itemsThe free version tracks four.
- All regionsNortheast, Midwest, South, and West, side by side.
- Pick your stateElectricity and natural gas for all 50 states and DC, gasoline for 9 states. Groceries show your region, labeled.
- Compare statesRank states by electricity, natural gas, and gasoline prices.
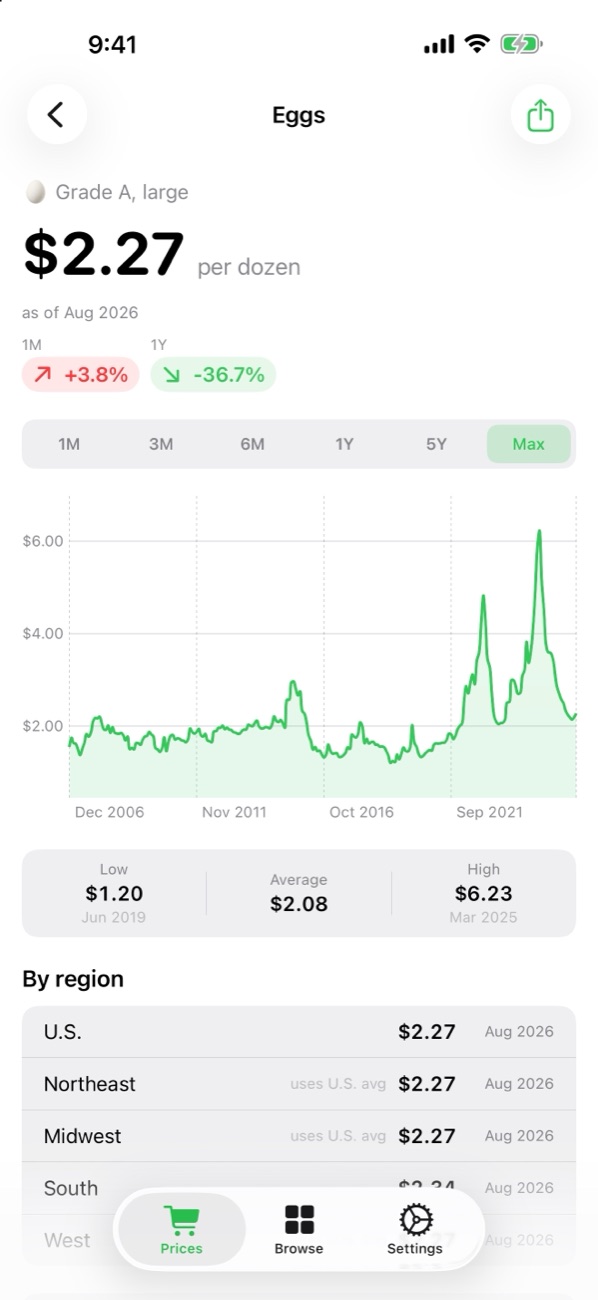
- Full history5-year and 20-year charts.
- Basket trendsYour basket total over time.
- Price alertsPer-item alerts when something moves.
- More widgetsMulti-item and My Basket widgets.
- CSV exportAny series, ready for a spreadsheet.
Straight from the source
Bureau of Labor Statistics
U.S. and regional prices come from the BLS Average Price Data series, published every month alongside the Consumer Price Index. They are averages paid by urban consumers, not the price at your local store.
Energy Information Administration
State energy prices come from the U.S. Energy Information Administration: residential electricity and natural gas for all 50 states and DC, and regular gasoline for California, Colorado, Florida, Massachusetts, Minnesota, New York, Ohio, Texas, and Washington. EIA's state figures usually run a month or two behind BLS.
Your state, clearly labeled
BLS does not publish grocery prices by state, only for the U.S. and four regions. With a state picked in Pro, electricity, natural gas, and (where EIA has it) gasoline show your state's own price. Everything else shows your region's, labeled so you always know where a number comes from.
Honest about gaps
BLS sometimes stops publishing a regional series, and October 2025 has no data at all. StapleWatch tells you when that happens and draws the gap as a gap, never as a zero.
StapleWatch is an independent app made by MannyD.dev. It is not affiliated with, endorsed by, or operated by the Bureau of Labor Statistics, the Energy Information Administration, or any government agency.
Questions?
We read everything. Support, feedback and bug reports all go to the same inbox.